NASA Map Reveals How This Week’s Natural Disasters Affect Aerosol Velocity
NASA is tracking even the tiniest specks of matter.

Earth experienced several wildfires, hurricanes, and other natural disasters last week. As scientists continue to monitor and respond to these volatile climate conditions, NASA offered a glimpse at how such events affect even the tiniest, often-unseen specks of matter that are ubiquitous in the air.
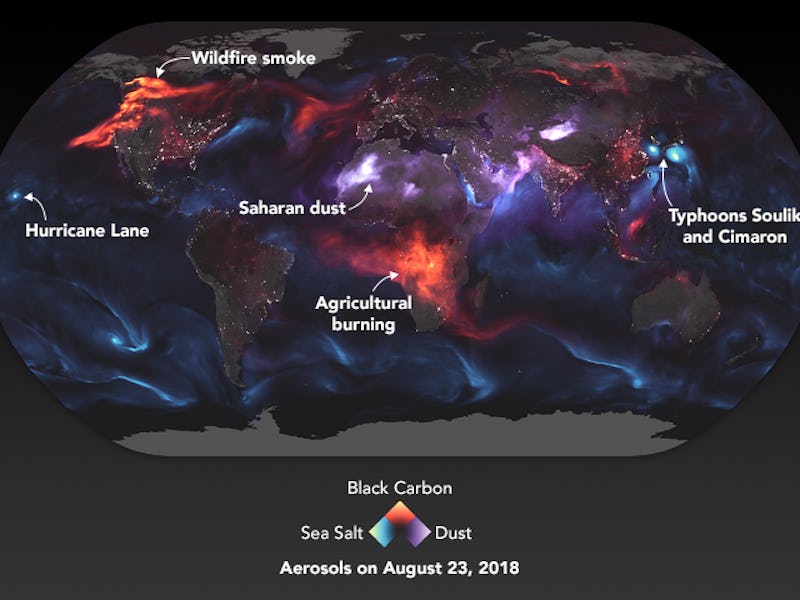
On Friday, NASA published a map of the Earth that showcased the current ebbs and flows of aerosols, which are solid particles or liquid droplets suspended in air. Using a model called the Goddard Earth Observing System Forward Processing, or GEOS FP, the space agency was able to enhance the colorization of each particle type to reflect aerosol velocity and presence as it was recorded on Thursday, August 23.
Visualization of aerosol movement on August 23.
Rather than using satellite data, the GEOS FP is a weather and climate model that uses mathematical equations to represent physical processes and calculate what was happening in the atmosphere that day. However, NASA’s Earth Observatory did use some satellite input from Moderate Resolution Imaging Spectroradiometer (MODIS) sensors to track fire radiative power and simulate real-time conditions.
As evident in NASA’s visualization, Thursday was eventful. The map displays black carbon particles in red, which NASA describes as aerosols released by fires or from vehicle and factory emissions. Thus, the red and orange swirls in North America reflect the wildfires that continue to rage across the west coast of the US and Canada. Meanwhile, hurricanes and tropical storms, like those affecting Hawaii, South Korea, and Japan, launch aerosols through sea spray, as evident in the concentrated swirls of light blue. While these maps are visually striking, NASA reminded viewers of the violent situations some of the swirls represent.
Aerosol mapping of Asia.
“Some of the events that appear in the visualization were causing pretty serious problems on the ground,” the agency explained on its website. “On August 23, Hawaiians braced for torrential rains and potentially serious floods and mudslides as Hurricane Lane approached. Meanwhile, twin tropical cyclones—Soulik and Cimaron—were on the verge of lashing South Korea and Japan. The smoke plume over central Africa is a seasonal occurrence and mainly the product of farmers lighting numerous small fires to maintain crop and grazing lands. Most of the smoke over North America came from large wildfires burning in Canada and the United States.”
While aerosols are often unseen, humans breathe in millions of these ubiquitous specks of matter and their presence and patterns are of great importance to scientists, especially as they monitor the behavior of wildfires and the emergence of carbon black plumes. The Earth Observatory intends to routinely include these aerosol mappings into other models and weather-mapping systems to better simulate real-world conditions as they unfold.