Culture
Fitbit can now read your blood oxygen saturation (which means Google can, too)
It’s another piece of personal data now owned by the tech giant.

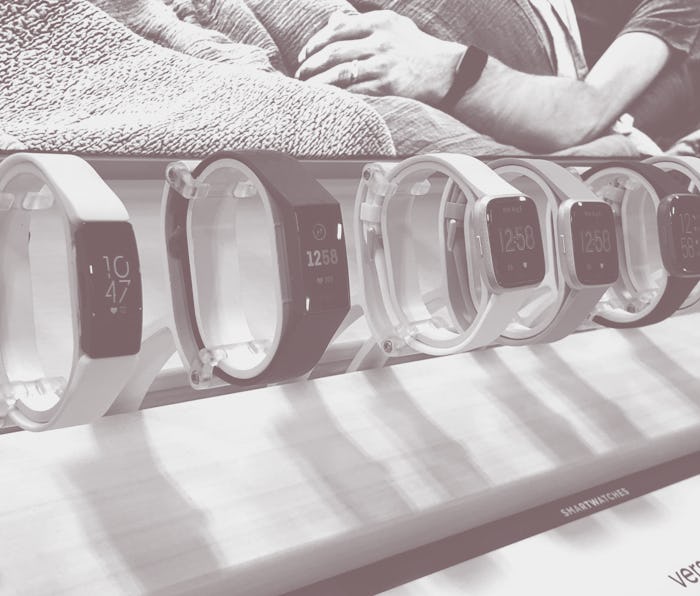
Long gone are the days when a Fitbit merely counted steps taken and calories burned — now the company’s high-end offerings are almost as data-diverse as a trip to the doctor’s office. Fitbit’s newest feature is perhaps its most ambitious yet: blood oxygen tracking. The feature is available on the Fitbit Ionic, Versa, Versa Lite, Versa 2, and Charge 3.
Yes: your watch can now detect levels of oxygen in your blood. That could be good for those monitoring breathing issues — but it also means another layer of your health data that’s being controlled by Google.
All of Fitbit’s data is now owned by Google — That’s not necessarily a bad thing, but it could be. Once Google’s acquisition of Fitbit is complete, it will be up to Google to protect every bit of data collected from Fitbit’s 28 million users. That includes users’ height, weight, sleep patterns, life coaching summaries, and location data. Now we can add oxygen saturation to that list, too.
Fitbit has made efforts to quell user suspicions about data collection. But Google’s past with health data doesn’t exactly label it as trustworthy.
Google has a storied history with health data — In November, it was revealed that Google had been collecting health data from millions of patients without their consent as part of something called Project Nightingale. The collected data included everything from single lab results to complete medical histories. Sources confirmed that dozens of Google workers could access this information at any time. Google responded by telling us that all of this is technically legal. Very comforting.
Previously, Google was also found to be inappropriately accessing health data through the University of Chicago Medical Center.
The feature is still rolling out — Users will have the option to enable Fitbit’s Estimated Oxygen Variation tracking soon; it isn’t available to everyone just yet. At launch, the feature graphs “small variations” and “big variations” without noting exact percentage readings.